The Metric That Separates Real Marketing From Vanity Metrics
If your marketing dashboard shows:
• 10,000 leads
• 2% CTR
• Low CPL
• Strong engagement
• 10,000 leads
• 2% CTR
• Low CPL
• Strong engagement
But your CFO asks, “How much revenue did this generate?”
And you hesitate.
You do not have a marketing problem.
You have a revenue visibility problem.
Pipeline ROI is the bridge between marketing activity and business impact.
Most teams measure performance.
Few measure profitability.
What Is Pipeline ROI?
Pipeline ROI answers one simple question:
For every dollar spent, how much qualified pipeline and revenue did we generate?
It is not CPL.
It is not MQL volume.
It is not impressions.
It is structured revenue efficiency.
Formula:
Pipeline ROI = (Pipeline Generated ÷ Marketing Spend)
Revenue ROI = (Closed Revenue ÷ Marketing Spend)
| Metric | Value |
|---|---|
| Marketing Spend | $1.5M |
| Pipeline Generated | $40M |
| Closed Revenue | $8M |
Pipeline ROI = 26.6X
Revenue ROI = 5.3X
That is the language leadership understands.
Why Most Marketing Teams Avoid This Metric
Because it exposes weak strategy.
Common reasons:
• No CRM lifecycle tracking
• Poor attribution setup
• Misalignment with sales
• No stage-level tracking
• Campaign-based reporting mindset
If you cannot trace:
Campaign → Lead → SQL → Opportunity → Revenue
You cannot claim ROI.
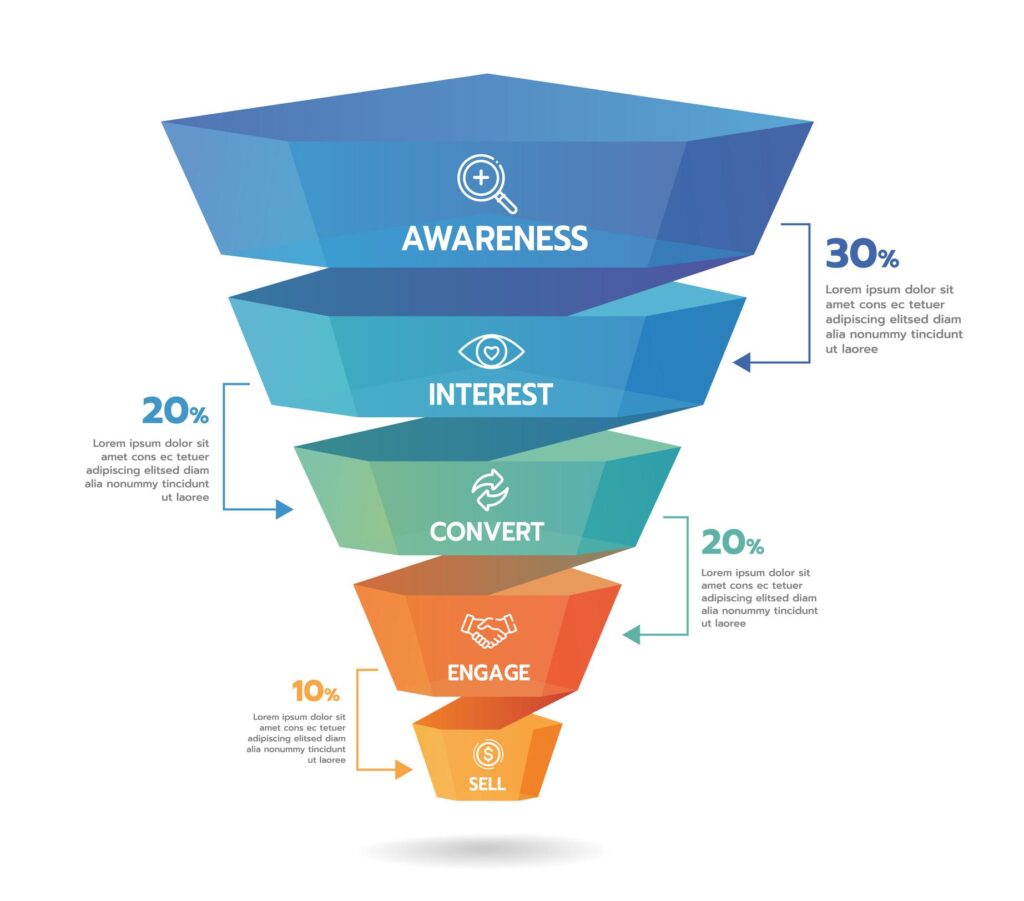
The Revenue Funnel That Actually Matters
Break your funnel into revenue stages:
Impression
Click
Lead
MQL
SQL
Opportunity
Closed Won
Now assign:
• Cost
• Conversion %
• Revenue value
Example funnel diagnostics:
| Stage | Conversion % | Cost per Stage | Insight |
|---|---|---|---|
| Lead → MQL | 45% | Efficient | Healthy targeting |
| MQL → SQL | 20% | Weak | Over-scoring |
| SQL → Opp | 28% | Concerning | Qualification gap |
| Opp → Won | 25% | Strong | Sales effective |
Marketing should optimize the weakest revenue stage, not the loudest metric.
Multi-Touch Attribution: The Truth Behind Influence
Single-touch attribution is outdated.
In B2B:
• Buyers interact 6–10 times before sales engagement
• Multiple channels influence pipeline
• Content plays a nurturing role
Attribution models to consider:
| Model | Best Use Case |
|---|---|
| First Touch | Demand creation |
| Last Touch | Conversion capture |
| Linear | Balanced view |
| Time Decay | Long cycles |
| Position-Based | Hybrid |
Executive-level reporting should include:
• Pipeline Generated (Primary Source)
• Pipeline Influenced (Multi-touch)
• Revenue Influenced
Channel-Level ROI Reality Check
Not all channels deserve equal budget.
Evaluate each channel on:
- Cost per SQL
- Cost per Opportunity
- Win Rate by Channel
- Average Deal Size
- Deal Velocity
Example:
| Channel | Cost per Opp | Win Rate | Revenue ROI |
|---|---|---|---|
| Search | Low | High | Strong |
| LinkedIn ABM | Medium | High | Strong |
| Display | Low | Low | Weak |
| Content Syndication | High | Low | Poor |
Engagement can mislead.
Revenue does not.
Where Revenue Leakage Usually Happens
From funnel audits across B2B programs, most leakage occurs in:
• Over-inflated MQL definitions
• Weak intent scoring
• Slow SDR response time
• Poor ICP filtering
• Budget allocated to awareness-heavy channels
Fixing just MQL → SQL can improve pipeline efficiency by 15–30%.
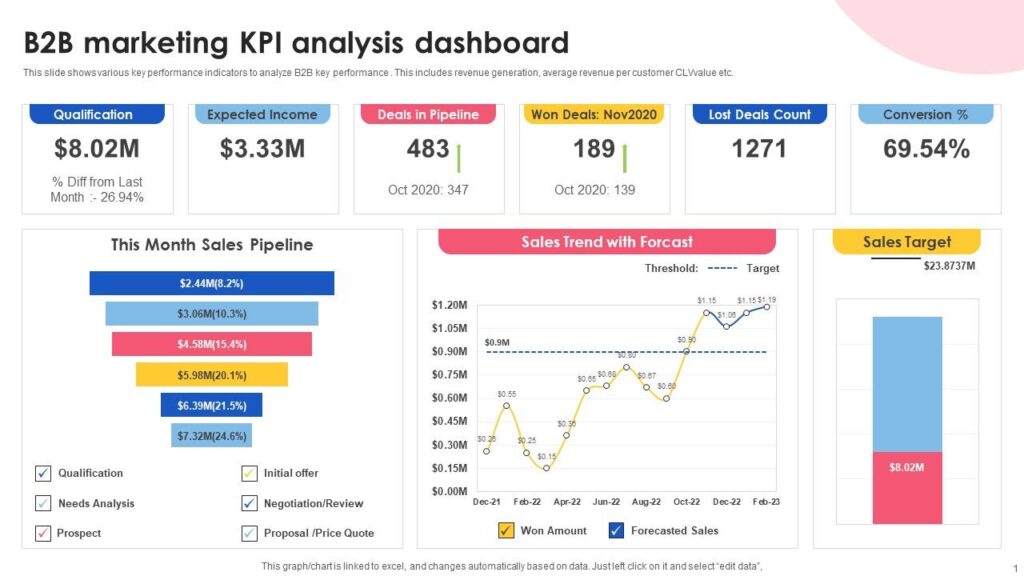
Building a Revenue-Focused Reporting Dashboard
Your executive dashboard should answer:
• How much pipeline did marketing generate?
• What is cost per opportunity?
• What is marketing-influenced revenue?
• Which channel drives highest win rate?
• Where is the largest drop-off?
Core metrics to include:
- Pipeline Generated
- Pipeline Influenced
- Revenue Closed
- Cost per SQL
- Cost per Opportunity
- Stage Conversion %
- Pipeline Velocity
If your dashboard does not show velocity, it is incomplete.
From Budget Allocation to Capital Allocation
This is the mindset shift.
Marketing budget should behave like investment capital.
Reallocation framework:
• Increase spend on high win-rate channels
• Reduce spend on high MQL but low SQL channels
• Double down on ICP-aligned segments
• Cut channels with poor revenue attribution
Marketing maturity = disciplined capital deployment.
Case Scenario: Structural Optimization
Marketing Spend: $1.5M
Initial Pipeline: $25M
SQL Conversion: 18%
After:
• Funnel stage optimization
• SQL scoring refinement
• Channel reallocation
• Sales alignment
Results:
Pipeline: $40M
SQL Conversion: 28%
Win Rate Improved
Deal Velocity Reduced
Same budget.
Better structure.
Higher revenue efficiency.
The Strategic Advantage
When marketing speaks in revenue terms:
• Sales alignment improves
• Leadership trust increases
• Budget approvals accelerate
• Forecasting becomes accurate
• Growth becomes predictable
Pipeline ROI is not a reporting metric.
It is a credibility metric.
Final Thought
Traffic is activity.
Leads are output.
Pipeline is progress.
Revenue is impact.
If your marketing cannot connect spend to revenue,
it is performance theater.
Measure what matters.
Optimize what leaks.
Scale what converts.