The Growth Engine Most B2B Companies Misunderstand
If your pipeline looks healthy but revenue feels unpredictable, you don’t have a lead problem.
You have a demand generation problem.
Most B2B companies celebrate MQL volume.
High downloads. High webinar registrations. Strong CTR.
Then something strange happens.
SQL conversion drops.
Demand generation is not about filling the top of the funnel.
Opportunities stall.
Win rates decline.
Sales complains about lead quality.
It is about engineering revenue across the entire funnel.
This is where most companies get it wrong.
What Demand Generation Actually Means
Sollicitudin bibendum nam turpis non cursus eget euismod egestas sem nunc amet, tellus at duis suspendisse commodo lectus accumsan id cursus facilisis nunc eget elementum non ut elementum et facilisi dui ac viverra sollicitudin lobortiDemand generation is a full-funnel, revenue-aligned system designed to:
• Create awareness among the right ICP
• Capture high-intent signals
• Convert marketing engagement into qualified pipeline
• Improve SQL-to-Opportunity ratio
• Accelerate deal velocity
• Increase pipeline ROI
It is not lead generation.
It is revenue orchestration.s luctus sociis sed massa accumsan amet sed massa lectus id dictum morbi ullamcorper.
The Real Problem: Volume vs Revenue
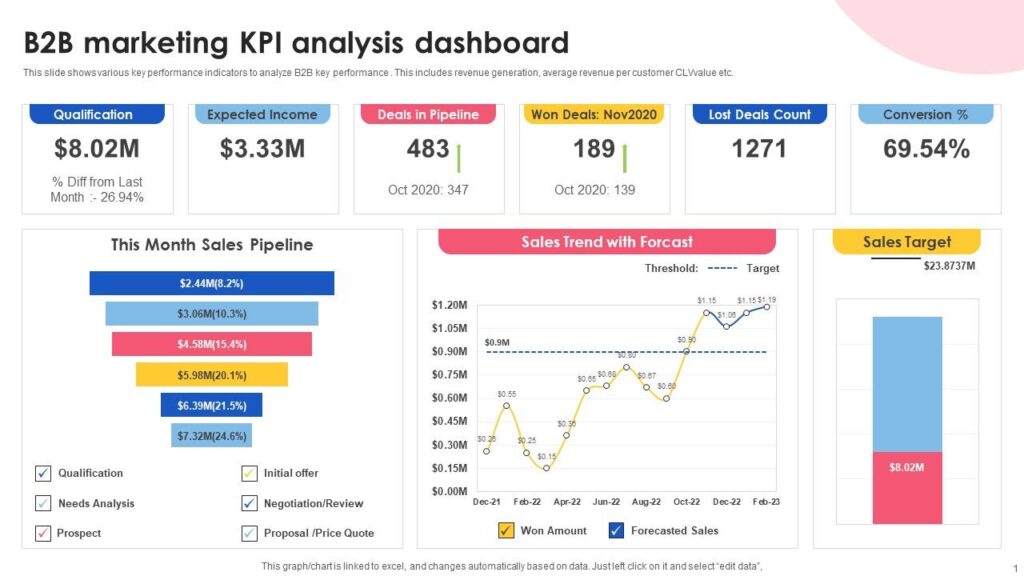
Here is what typical dashboards look like:
| Metric | Looks Good | Reality |
|---|---|---|
| MQL Volume | High | Poor SQL conversion |
| CPL | Low | Low buying intent |
| Webinar Signups | Strong | Weak pipeline impact |
| Traffic | Growing | Revenue stagnant |
Marketing optimizes for cost efficiency.
Sales optimizes for deal closure.
Demand generation aligns both around one metric:
Pipeline contribution and revenue efficiency.
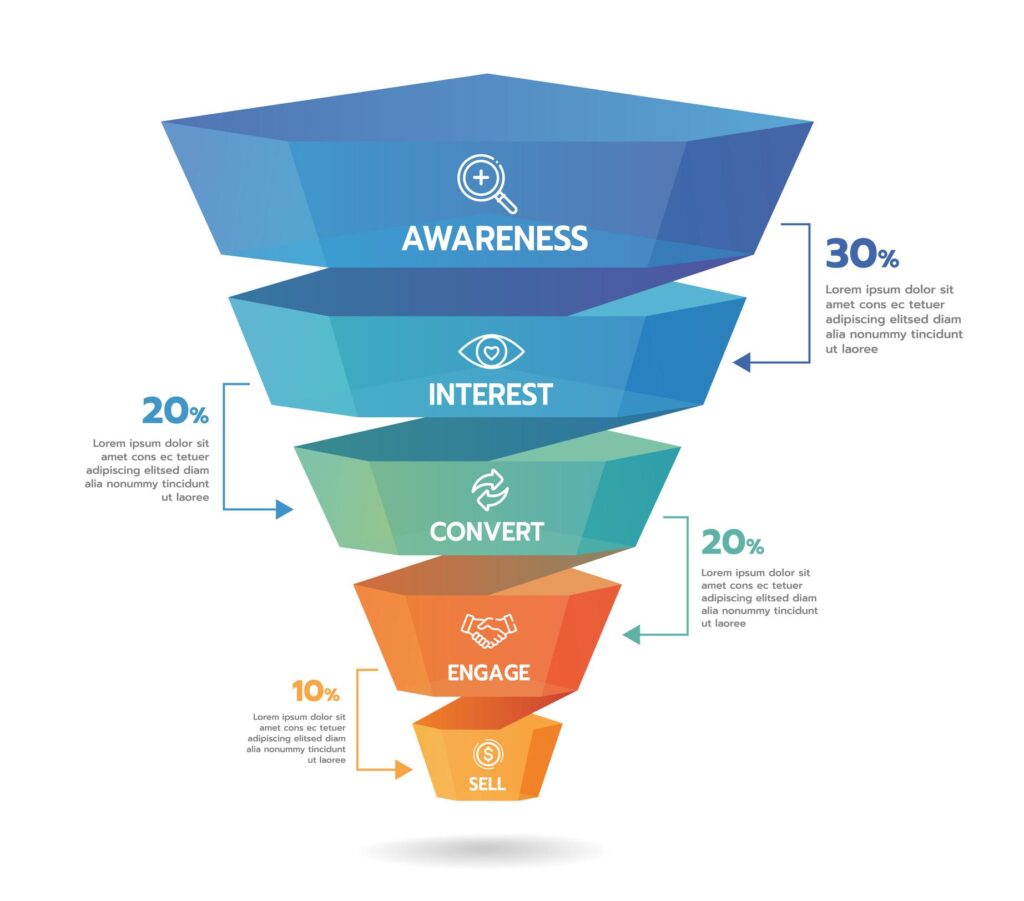
The 5-Stage Demand Generation Engine
Let’s break this down practically.
1️⃣ Funnel Audit: Diagnose Before You Scale
Break your funnel into measurable stages:
Impressions → Clicks → Leads → MQL → SQL → Opportunity → Closed Won
Now calculate:
• Conversion rate at each stage
• Cost per stage
• Drop-off percentage
• Channel contribution to pipeline
Example:
| Stage | Conversion % | Drop-off |
|---|---|---|
| Lead → MQL | 42% | Normal |
| MQL → SQL | 18% | Concerning |
| SQL → Opportunity | 30% | Major leakage |
If engagement is strong but SQL conversion is weak, your targeting is broad.
If SQL to Opportunity is weak, your qualification or SDR alignment is broken.
Most companies never analyze this deeply.
2️⃣ Channel Reality Check: Engagement Is Not Intent
Not all channels drive buying behavior.
Here is a simple prioritization framework:
| Channel Type | Intent Level | Strategic Use |
|---|---|---|
| Search | High | Capture demand |
| LinkedIn ABM | High | Account targeting |
| Display | Medium | Retargeting |
| Social Broad | Low | Awareness |
| Content Syndication | Mixed | Lead volume |
If one channel contributes:
• 40% spend
• 55% MQL
• 10% SQL
That is not growth. That is noise.
Reallocate budget toward channels contributing to:
• Cost per SQL
• Cost per Opportunity
• Pipeline revenue
3️⃣ SQL Quality Deep Dive
This is where demand generation becomes strategic.
Take two segments:
A) SQLs that converted to opportunities
B) SQLs that did not convert
Compare across:
• Industry
• Company size
• Buying trigger
• Engagement depth
• Time to first contact
• Decision-maker involvement
Patterns always emerge.
Example Insight:
Converted SQLs had:
• 3+ high-intent page visits
• Decision-maker job titles
• Industry alignment
• Faster SDR follow-up
Non-converted SQLs:
• Single asset download
• Mid-level contacts
• No intent signals
Solution:
Refine scoring model.
Adjust targeting.
Align SDR playbooks.
4️⃣ Post-SQL Alignment: Where Revenue Is Won
Marketing often disengages at SQL.
That is a mistake.
Demand generation continues beyond SQL.
Key levers:
• SDR follow-up within 5 minutes
• Qualification criteria clarity
• Feedback loops every 2 weeks
• CRM visibility across funnel
• Opportunity stage analytics
Impact of tight alignment:
| Metric | Before | After Alignment |
|---|---|---|
| SQL → Opportunity | 22% | 35% |
| Win Rate | 18% | 26% |
| Deal Velocity | 90 days | 65 days |
This is not theoretical.
This is structural optimization.
5️⃣ Automation and Revenue Tracking
Without automation, scaling demand generation is impossible.
Critical systems:
• Marketing automation platform
• CRM lifecycle tracking
• Lead scoring model
• Multi-touch attribution
• Revenue reporting dashboard
Key metrics to monitor weekly:
• Cost per SQL
• Cost per Opportunity
• Pipeline ROI
• CAC vs LTV
• Stage conversion %
If you are not measuring pipeline ROI, you are guessing.
The Strategic Shift: From Campaigns to Systems
Many marketing teams operate campaign to campaign.
Demand generation operates as a system.
Campaign thinking:
“We launched a webinar.”
Demand thinking:
“How did that webinar influence pipeline velocity?”
Campaign thinking:
“We hit MQL target.”
Demand thinking:
“What is the cost per closed won influenced by this channel?”
That mindset shift changes everything.
Numbers That Matter
If you want executive credibility, track these:
- Pipeline Generated
- Pipeline Influenced
- Revenue Influenced
- Cost per Opportunity
- Win Rate by Channel
- Deal Velocity by Source
Anything else is secondary.
Where Companies Lose 30% of Revenue Potential
Based on observed funnel diagnostics, revenue leakage typically happens at:
• MQL to SQL transition
• SQL to Opportunity qualification
• Delayed SDR follow-up
• Weak intent filtering
• Budget allocated to low-intent engagement
Fixing just one stage can increase pipeline by 20–40%.
Demand Generation Is a Growth Multiplier
When structured properly, demand generation delivers:
• Predictable pipeline
• Improved marketing credibility
• Better sales alignment
• Higher revenue efficiency
• Faster deal cycles
It transforms marketing from a cost center into a growth driver.
Final Thought
Leads are easy.
Revenue is engineered.
If your dashboard celebrates volume but your CFO questions ROI, the solution is not more traffic.
It is structured demand generation.